Multi-Scale Time Activity Data Exploration via
Temporal Clustering Visualization Spreadsheet
Multi-Scale Time Activity Data Exploration via
Temporal Clustering Visualization Spreadsheet
Abstract
Multi-scale Time Activity Data Exploration via Temporal Clustering Visualization Spreadsheet, accepted to IEEE Transactions on Visualization and Computer Graphics, Jonathan Woodring and Han-Wei Shen
Publication
Time-varying data is usually explored by animation or arrays of static images. Neither is particularly effective for classifying data by different temporal activities. Important
temporal trends can be missed due to the lack of ability to find them with current visualization methods. In this paper,
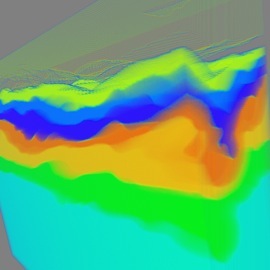
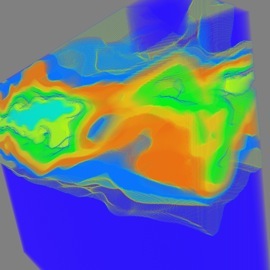
we propose a method to explore data at different temporal resolutions to discover and highlight data based upon timevarying trends. Using the wavelet transform along the time axis, we transform data points into
multi-scale time series curve sets. The time curves are clustered so that data of similar activity are grouped together, at different
temporal resolutions. The data are displayed to the user in a global time view spreadsheet where she is able to select temporal clusters of data points, and filter and brush data across temporal scales. With our method, a user can interact with data based on time activities and create expressive visualizations.
Download

The Ohio State University, Department of Computer Science and Engineering
395 Dreese Lab, 2015 Neil Avenue, Columbus OH 43210
Professor Han-Wei Shen
hwshen@cse.ohio-state.edu (V) 614 292 0060 (F) 614 2922911