Data Visualization
Melbourne Business School
University of Melbourne
Morning: 9 AM - 12 PM
Afternoon: 2:30 PM - 5:30 PM
- First hour:
- Second hour:
- Each team prepares a 10 minutes presentation to explain the figures
and their insights. Critic the visualization if possible
- Create a simple web page to summarize the main points of your
presentation.
Consult "Interactive Data Visualization" Chapter 3 for technical details. Submit the HTML files to LMS by next
week.
- Third hour:
11/06/2015
Morning: 9 AM - 12 PM
Afternoon: 2:30 PM - 5:30 PM
D3: Tutorials and book
D3 example to test your browser
-
Click on this ohio state link to test whether your web browser can run D3.
- Test if your local web server and D3 are properly set up:
- Run the command shell, go (i.e., cd) to a folder where you want to start
a local web server. For example, a folder that you will put your
D3 Code.
- Type in this command (I assume you already
have python installed) : python -m
SimpleHTTPServer 8888
- Run your browser and type in the address:
http://localhost:8888 and you should see the local
files and folders where you start your browser.
- Download this
zip file, unzip it and put it in your folder where you start
your browser.
- Go to the appropriate foler, find the file, svg_scatterplot.html, and click on it to
run. You should see the same result as what you will see when
you click on the ohio state link above.
Week2 D3 Workshop
-
Week 2 D3 Workshop
, prepared by Patrick Pang.
-
download your exercise data here.
-
sample image 1
-
sample image 2
- Prof. Shen's laughable and incomplete
solutions . The circle chart is closer, but the bar chart is upside down, and does not even use the csv
file! If you want, see how much you can improve to get them better
by next week :-)
- *** NEW *** An improved laughable
bar chart done by Prof. Shen (but still csv data reading). Download the file and
run. Can you see why it is better? Go ahead study and improve this
one if you like.
18/06/2015
Morning: 9 AM - 12 PM
Afternoon: 2:30 PM - 5:30 PM
Week3 D3 Workshop
Let's start to learn Tableau

Tableau is one of the most popular data visualization software. The
company was reported to enjoy several hundred millions dollars of
revenue last year. Many business now relies on using Tableau to
analyze their data. In this course, besides learning D3, you are
expected to learn how to use Tableau. It is likely that your syndicate
project will rely on Tableau to some extend, although I will require
you to use D3 to produce some visualization from the contest data
sets.
25/06/2015
Morning: 9 AM - 12 PM
Afternoon: 2:30 PM - 5:30 PM
Week4 D3 Workshop
02/07/2015
Morning: 9 AM - 12 PM
Afternoon: 2:30 PM - 5:30 PM
Week5 D3 Workshop
09/07/2015
Morning: 9 AM - 12 PM
Afternoon: 2:30 PM - 5:30 PM
Week6 D3 Workshop
16/07/2015
Morning: 9 AM - 12 PM
Afternoon: 2:30 PM - 5:30 PM
Syndicate Project Presentations
Syndicate Project
Project Due: 16/07/2015
- Project presentation in the afternoon
- Project report due at 11 PM
The syndicate project for this course is now announced. You are asked
to work with your team to solve
the challenges
for this year's
IEEE Visual Analytics Science and Technology contest.
You can choose to work on one of the mini-challenges(
MC-1
and
MC-2
), both mini-challenges, or
the
grand challenge.
This event will take place on
October 25-30 2015 in Chicago, USA. The deadline for
submit your entries
is July 7 2015
, which is close to our
syndicate project deadline. You are encouraged to participate the
participation, although it is not required.
Project requirement:
In addition to answering the questions listed in the contest web site, in your project
report and presentation, be sure to include the following information:
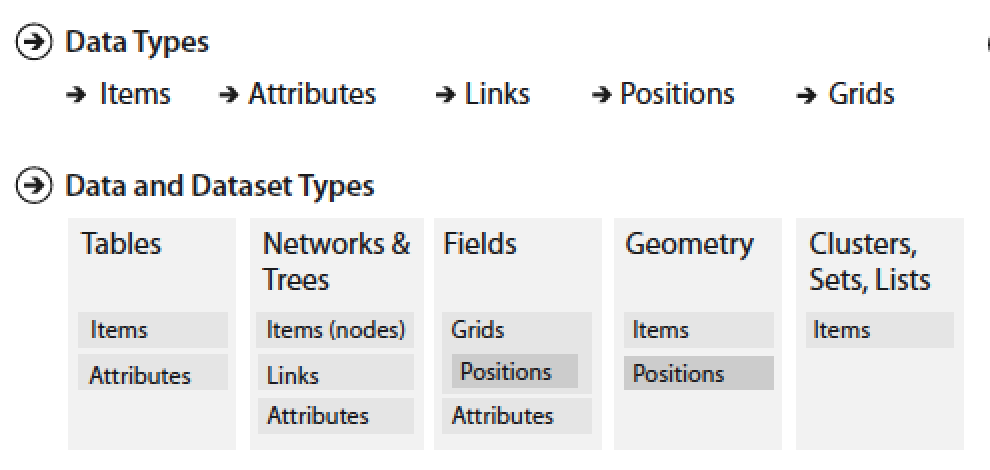
- Types of data that are involved in your visualization. If
you have done any additional data transformation steps, explain
what they are and why. Refer to
Tamara Chapter 2.
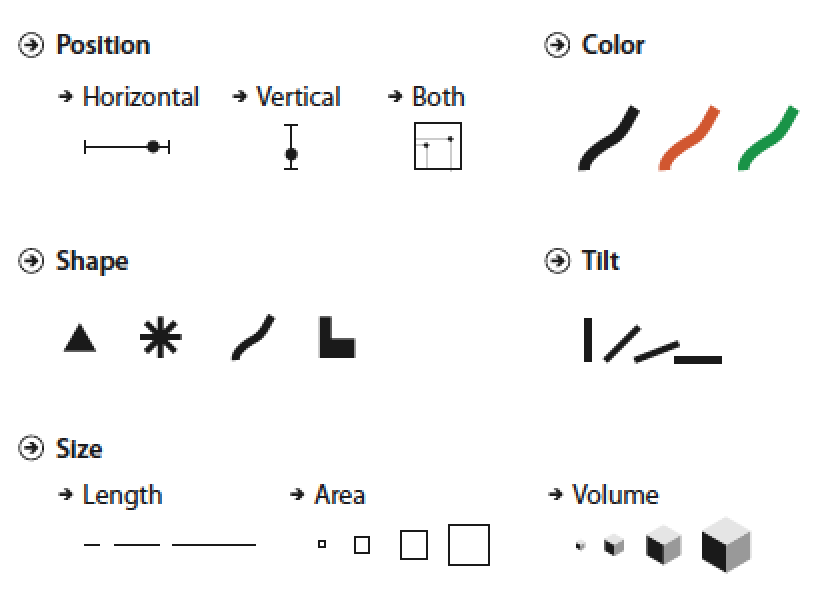
- Choice of marks and channels in your visualization with
justifications. Refer to
Tamara Chapter 5.
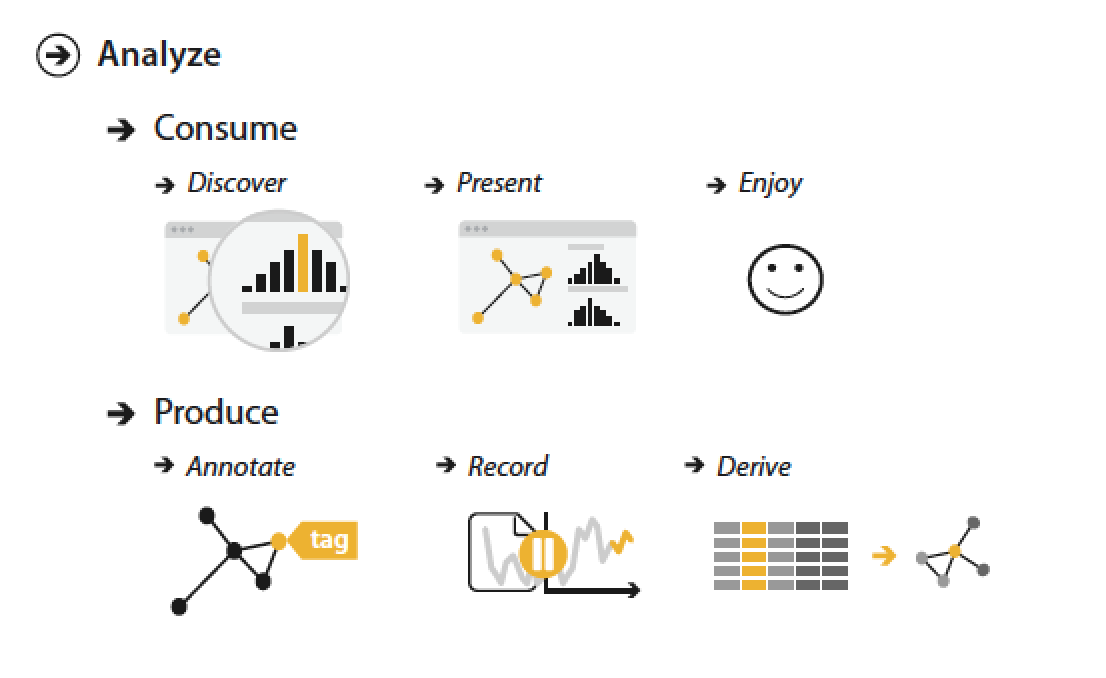
- Task abstraction. What visualization idioms discussed in class
are used in your project. Refer to
Tamara Chapter 3.
- Choice of visualization techniques and explain the insight of
each visualization. Refer to
Tamara Chapter 7 and
Tamara Chapter 9.
- Any data (items or attributes) reduction or aggregation
techniques used and how they help. Refer to
Tamara Chapter 13.
- Any manipulation and interactive control of views used and how
they help. Refer to
Tamara Chapter 11 and
Tamara Chapter 12.
- You are required to use D3 to generate at least three
visualization , together with visualization generated by any other
visualization software of your choice.
Links to Interesting Visualization
Last modified: Wed Jul 15 17:07:35 AEST 2015