Consider the following program.
Carefully trace the program to determine the program output by filling out the following tracing table. (We recommend that, when tracing inside the loop body, you put the value of the variable in the first iteration on the first line of the text area for that variable, and so on.) Do not move on to the next step until you are convinced you have the correct tracing table.
| Statement | Variable Values | |
|---|---|---|
| out.content = values = [8, -4, 3, 0, -5] i = 0 |
||
| while (i < values.length) { | ||
| out.content = values = [8, -4, 3, 0, -5] i = |
||
| int remainder = values[i] % 2; | ||
| out.content = values = [8, -4, 3, 0, -5] i = remainder = |
||
| if (remainder == 1) { | ||
| out.content = values = [8, -4, 3, 0, -5] i = remainder = |
||
| out.println("odd"); | ||
| out.content = values = [8, -4, 3, 0, -5] i = remainder = |
||
| } else { | ||
| out.content = values = [8, -4, 3, 0, -5] i = remainder = |
||
| out.println("even"); | ||
| out.content = values = [8, -4, 3, 0, -5] i = remainder = |
||
| } | ||
| out.content = values = [8, -4, 3, 0, -5] i = remainder = |
||
| i = i + 1; | ||
| out.content = values = [8, -4, 3, 0, -5] i = remainder = |
||
| } | ||
| out.content = values = [8, -4, 3, 0, -5] i = |
||
Follow these steps to set up a project for this lab.
Run the Oddity program and compare the output produced with your expected output. Do they match exactly? If not, can you explain why the program is doing something that is different from what you expected?
Trying to identify a bug in code is known as debugging. There are many techniques that can be employed to track down bugs; here we will concentrate on a specific tool provided by Eclipse.
Eclipse includes a debugging perspective, a sophisticated environment to help programmers detect and diagnose errors in running programs. The Eclipse debugging perspective allows you to control the execution of your program by setting breakpoints, suspending launched programs, stepping through your code, and examining the contents of variables.
Before you run a program in the debugger, you need to tell the debugger where you want it to pause execution. If you don't, the debugger executes the entire program to completion and you don't get a chance to use the debugger features.
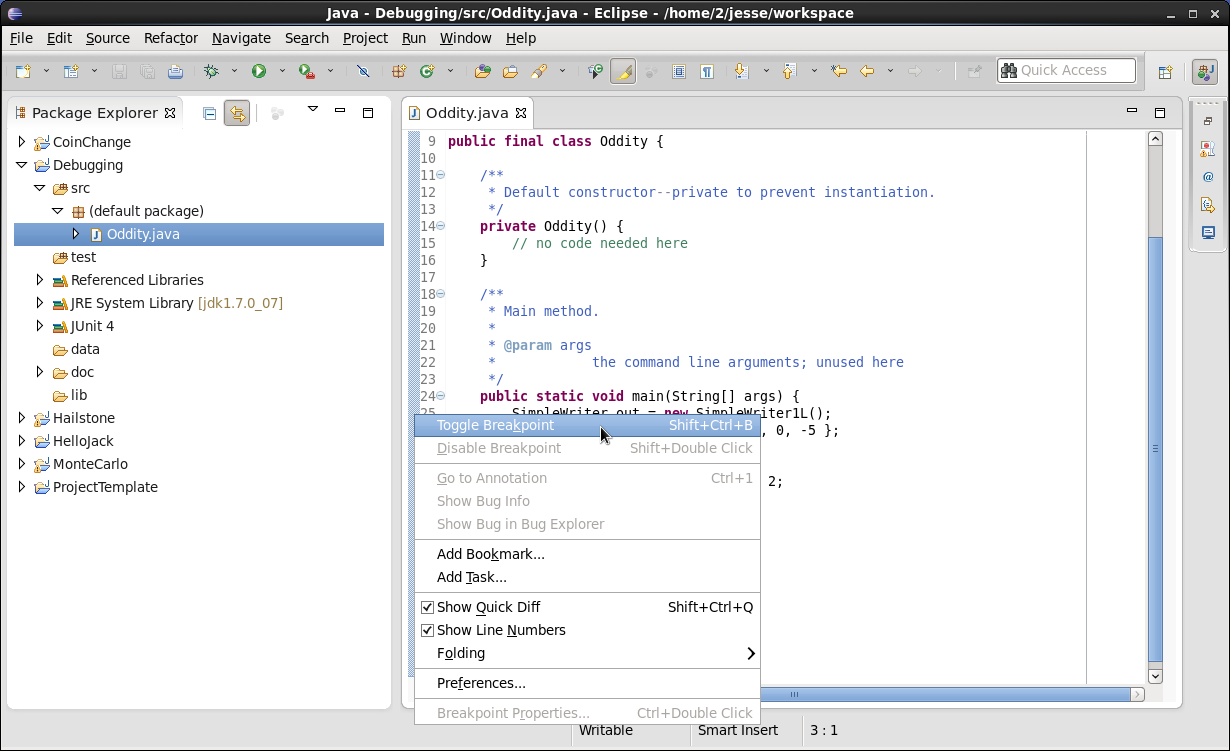
You can have the debugger pause at any statement in the program by
setting a breakpoint next to the statement. To set a
breakpoint, right click in the vertical bar to the left of the
editor window on the line corresponding to the statement where you
want the debugger to pause. In the contextual pop-up menu, select Toggle
Breakpoint.
The new breakpoint is indicated by the small dot on the left of the
statement.
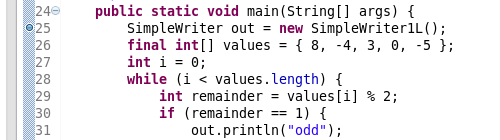
You should set a breakpoint next to the first statement of the main method. That's where program execution will halt in the debugger.
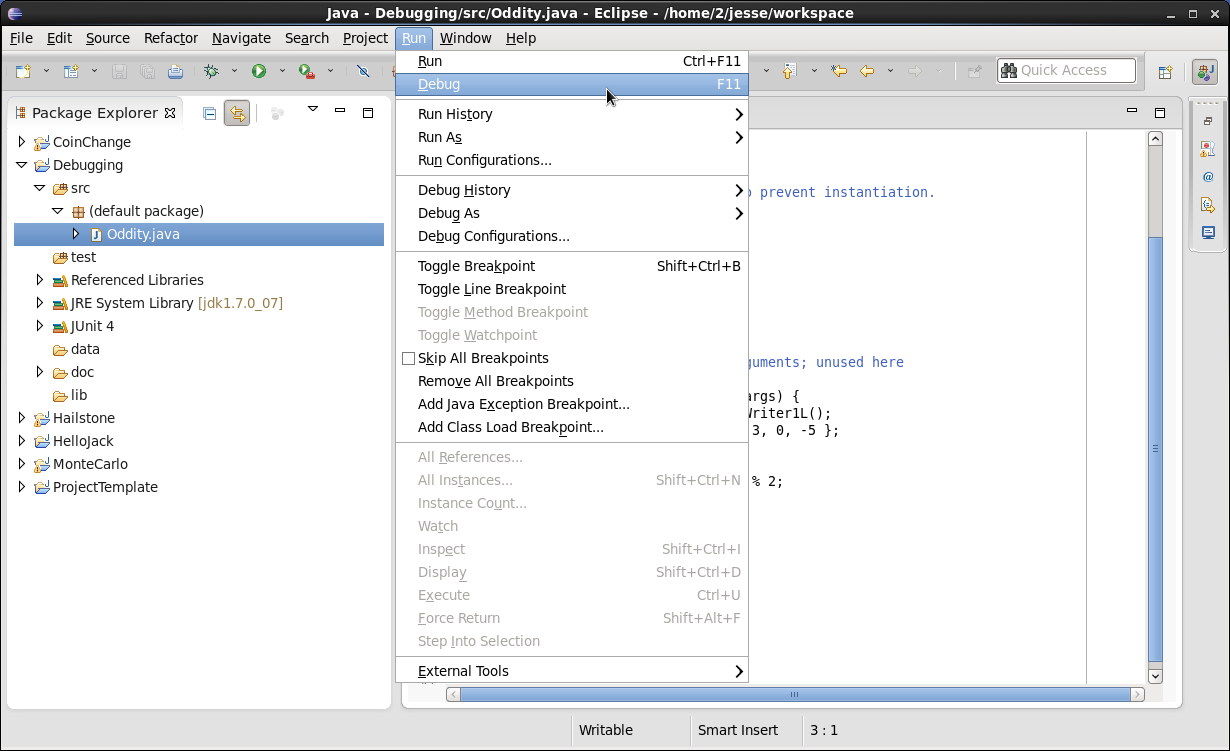
Now to start a program in the debugger, select Debug (instead
of Run) from the Run menu.
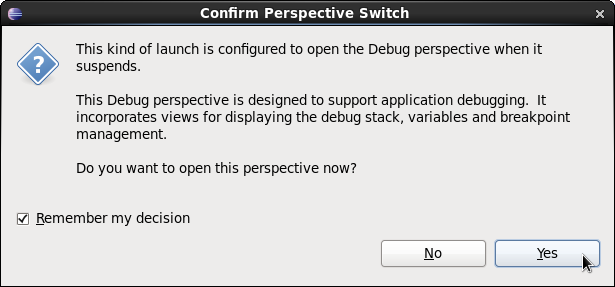
The first time you run the debugger, Eclipse asks you whether you
want to switch to the Debug perspective. You should check the
Remember my decision checkbox and click Switch.
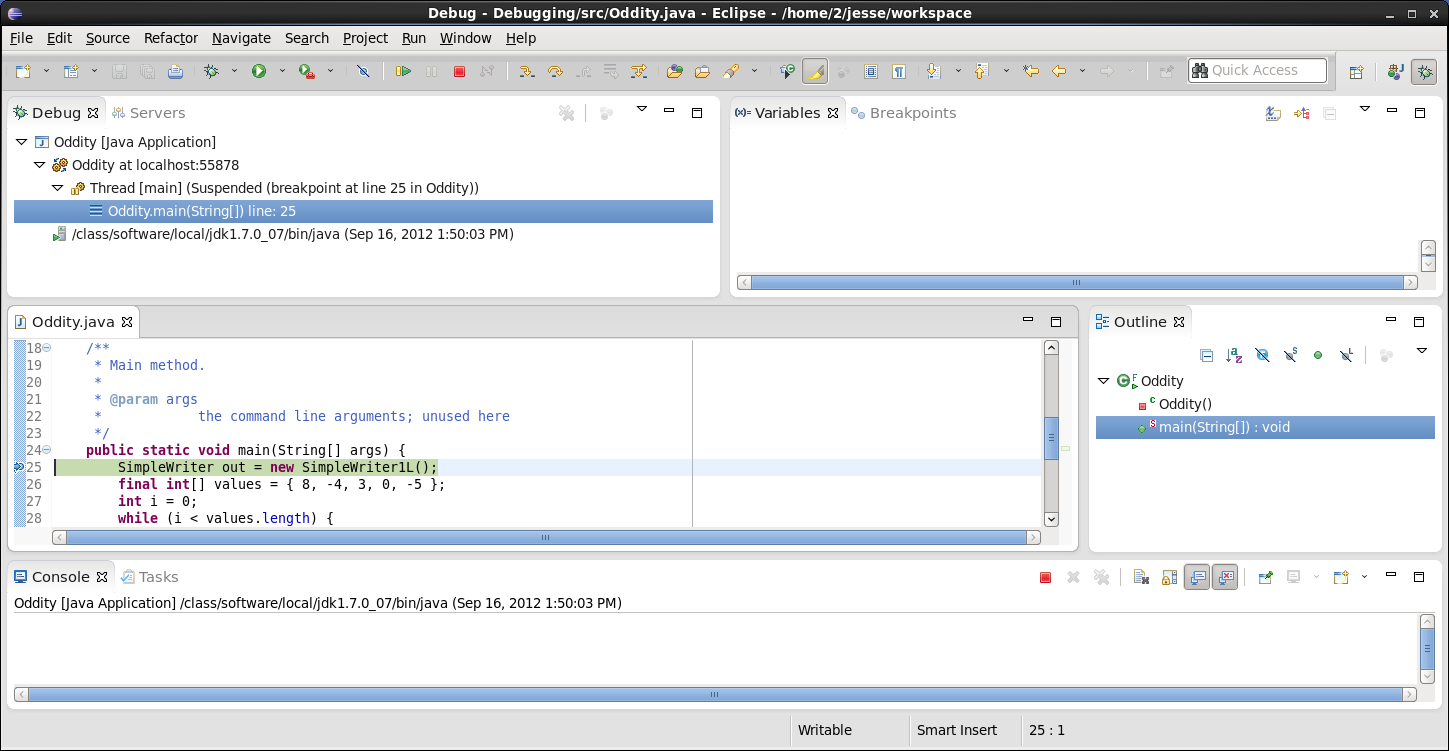
An Eclipse perspective is a collection of panels and tabs
containing views and editors to support a specific set of
development activities. The Debug perspective, as the name
implies, provides a debugging enviroment. Here are some of the more
important areas in the default Debug perspective. Here we
will not describe all the pieces, just those you will need for
today's activity.
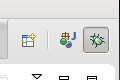
In the top right corner of the perspective, there are buttons
corresponding to all the open perspectives. Currently you should see
at least the Java perspective and the Debug
perspective buttons. You can switch to a different (open)
perspective by simply clicking that perspective button. For now,
make sure you remain in the Debug perspective.
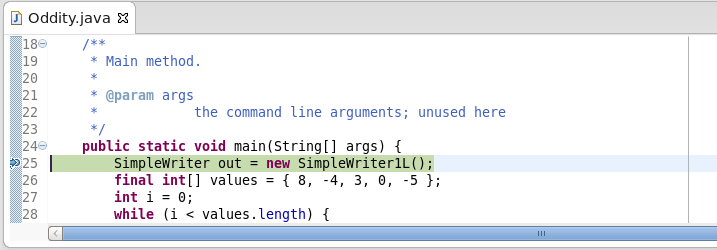
The left, middle panel is the Editor window where you can see
where your program execution is paused, and you can follow execution
when stepping through your program. Note that you can see (and set)
the breakpoint(s) to the left of the panel and also an arrow to the
left of the statement where execution was suspended: this arrow
indicates the next statement that will be excuted.
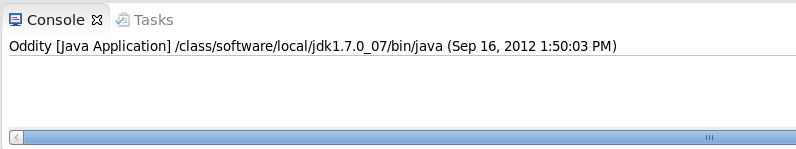
At the bottom of the perspective you can find the Console
panel where you can type your input and view the output of your
program.
The panel at the top right of the perspective houses various tabs
that allow you to explore the state of the program and control which
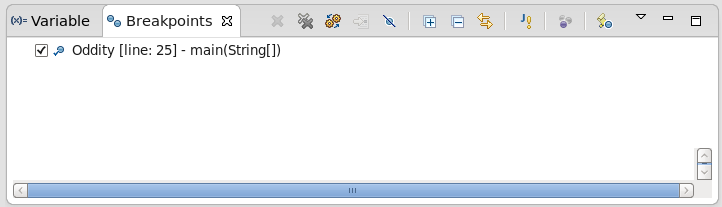
breakpoints are active. By default two tabs are open: the Variables
tab where you can observe the value of the variables in scope at the
point where the program is paused, and the Breakpoints tab
where you can review the exisiting breakpoints and
activate/deactivate them by simply checking or unchecking the
corresponding checkboxes.
Finally, at the top left of the perspective, in the toolbar, you can
find various buttons that can be used to control the program
execution. Hover over each one of them with the mouse and a tooltip
will appear telling what the functionality of each button is. In
particular, notice the buttons to Resume execution (resumes
execution until the next breakpoint is reached, or the program is
suspended, or the end of the program is reached), Suspend
execution (pauses the program), and Terminate execution (ends
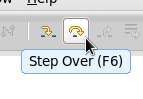
execution of the program) and those to Step Into (steps into
the method being invoked and pauses at the first statement in the
method), Step Over (executes a method call and pauses after
that), and Step Return (completes the execution of the
current method) and returns to the caller pausing after the call.

If you look at the Variables tab (top right), you can see that it lists only the args formal parameter to the main method because that is the only variable currently in scope. If you click on it, its value is displayed in the lower part of the Variables tab, but this is not very interesting because here we did not pass any command-line arguments to the program and so the array is empty and displayed simply as []. Let's make things more interesting.
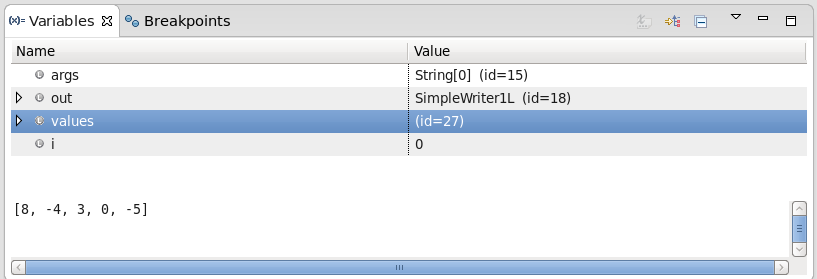
Let's execute the first three statements in main by
clicking three times on the Step Over button in the toolbar
at the top of the perspective.
After each click, notice the following:
Now click on each of the variables in the Variables panel and
you can see the current value for each.
Now single-step through the first iteration of the while loop; before each step think about what you think should happen and after each step verify that indeed the observed behavior matches the expected behavior of each statement. Any time a statement changes the value of a variable, you can see the updated value in the Variables tab.
After printing even for the first element of the array and incrementing the value of i to 1, you will find yourself back to the start of the while loop. You can continue stepping through the code one statement at a time until you get to the point where your trace and the actual observed behavior of the program differed. But, assuming that the issue (bug) you observed was with the last line of output where you probably thought that -5 being an odd number, the program should have printed odd , but instead it printed even , we can speed up getting to that point by setting another breakpoint on the first statement inside the loop (the one declaring and initializing the variable remainder ).
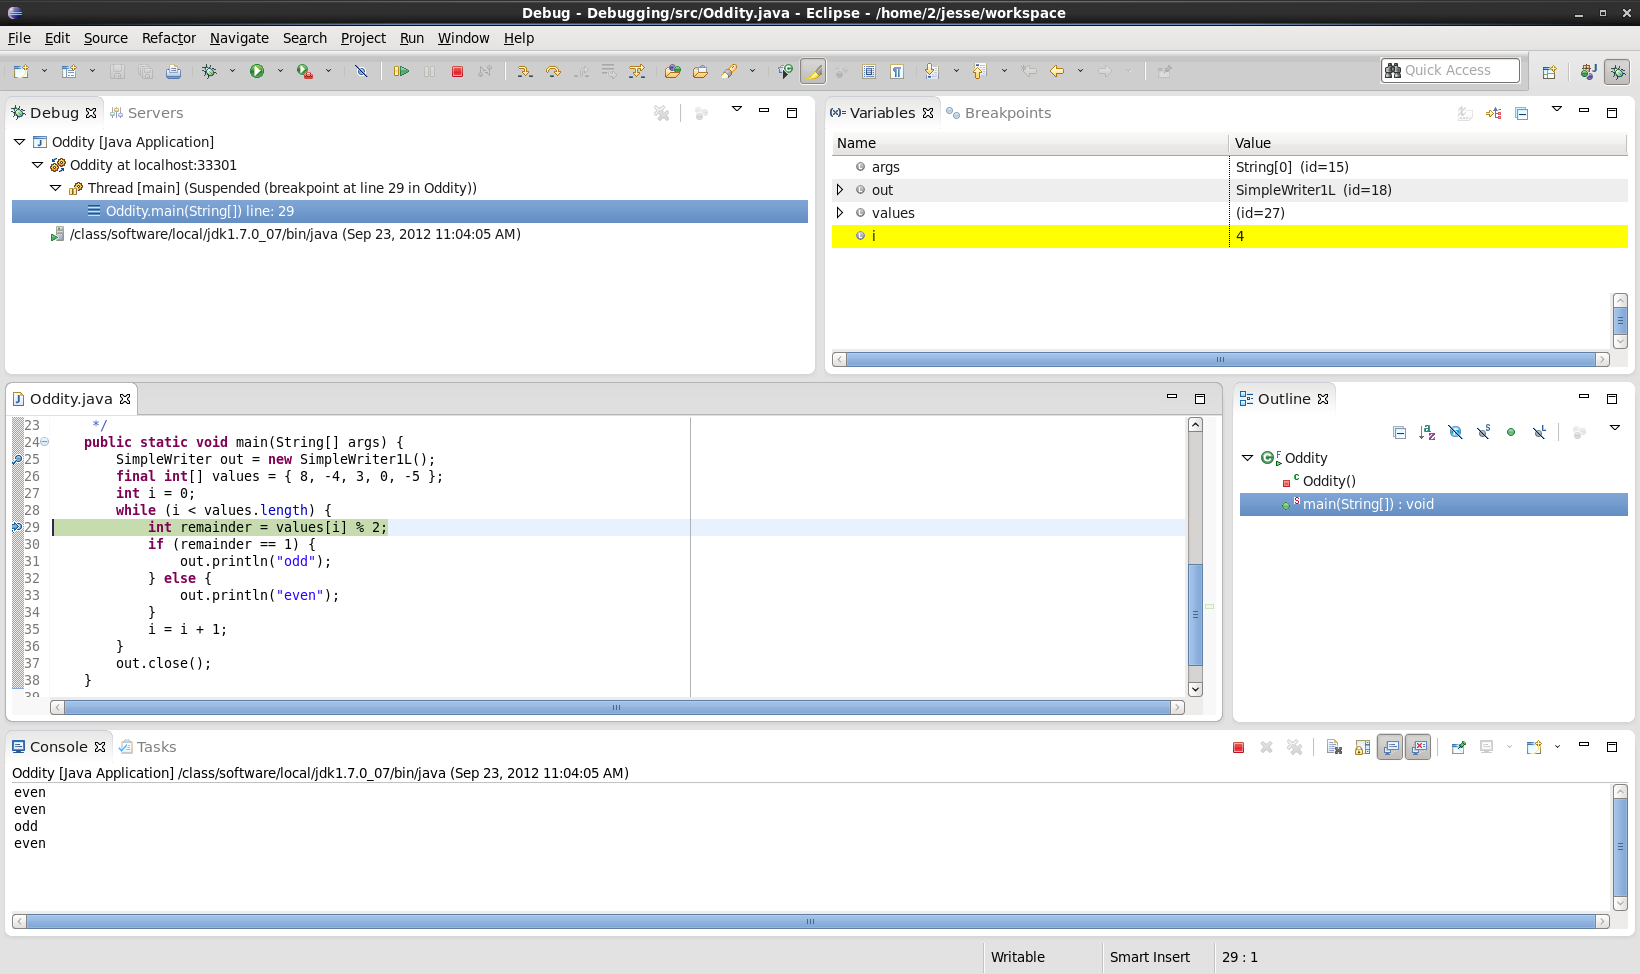
Set a breakpoint on the selected line by right-clicking on the left of the editor pane and selecting Toggle Breakpoint. Now click on the Resume button in the toolbar and see that the excution stops at the new breakpoint. Assuming the current value of i is 1, click on Resume 3 more times. After each click, check that the value of i has been incremented and that the correct output (even or odd) has been generated for the corresponding array element.
The state of the program should now show i = 4 and the
program should be suspended at the first statement in the loop body,
ready to compute the remainder of the division by 2 of the last
element of the values array (element at index 4 with value
-5). If by mistake you have already moved past this point, you
should simply stop execution (by clicking on the Terminate
button in the toolbar), restart the program in the debugger and make
sure you follow the steps above to stop execution of the program on
the first statement inside the loop with i set to 4.
Now single step over the assignment computing the ramainder for the last element of the array and look at the value of the remainder variable in the Variables tab. Can you explain what happened?
It turns out that the definition of the % (remainder) operator in Java satisfies this equation: (a / b) * b + (a % b) = a . Because integer division rounds toward 0, -5 / 2 = -2 and therefore the value of -5 % 2 that satifies the equation is -1.
Fix the program so that it prints the correct output for all array elements, then run the program and check that it behaves correctly. If it still does not work or some other bug arises as a result of your modifications, debug your code and fix all remaining problems.
One mystery solved! Now that you know the basics of using the debugger in Eclipse, you can try to solve a few more "puzzles".
Now consider the following programs. Again, first trace each of them carefully and determine what the output of each should be. Then enter them in Eclipse, run them, and compare the observed behavior with the predicted behavior. If they do not match exactly and you cannot explain the discrepancies, use the debugger in Eclipse to help you figure out what's going on.